
| Plan | ✓ Professional ✓ Advanced ✓ Scale ✓ Enterprise |
Let's take a peek at how your LinkedIn Company page analytics will look when you run a Profile Performance Report or a Post Performance Report with Vista Social!
LinkedIn (Company) Metrics for Profile Performance Report
Summary of fans (followers), posts, engagement, awareness, and impressions
Audience growth
Shows your net follower change during the selected period, along with your new followers and total follower count. Unfollows aren't shown separately due to third-party tool limitations.
Engagement
The number of follower interactions (reactions, comments, shares, clicks, and private messages) with your LinkedIn pages each day during the selected period, with a breakdown by type, the total, and the change compared to the previous period.
Brand awareness score
The number of shares of your page content and mentions of your page in comments and shares during the selected period. The chart breaks the score down by mentions, comment mentions, share mentions, and shares, with the total score and the change compared to the previous period.
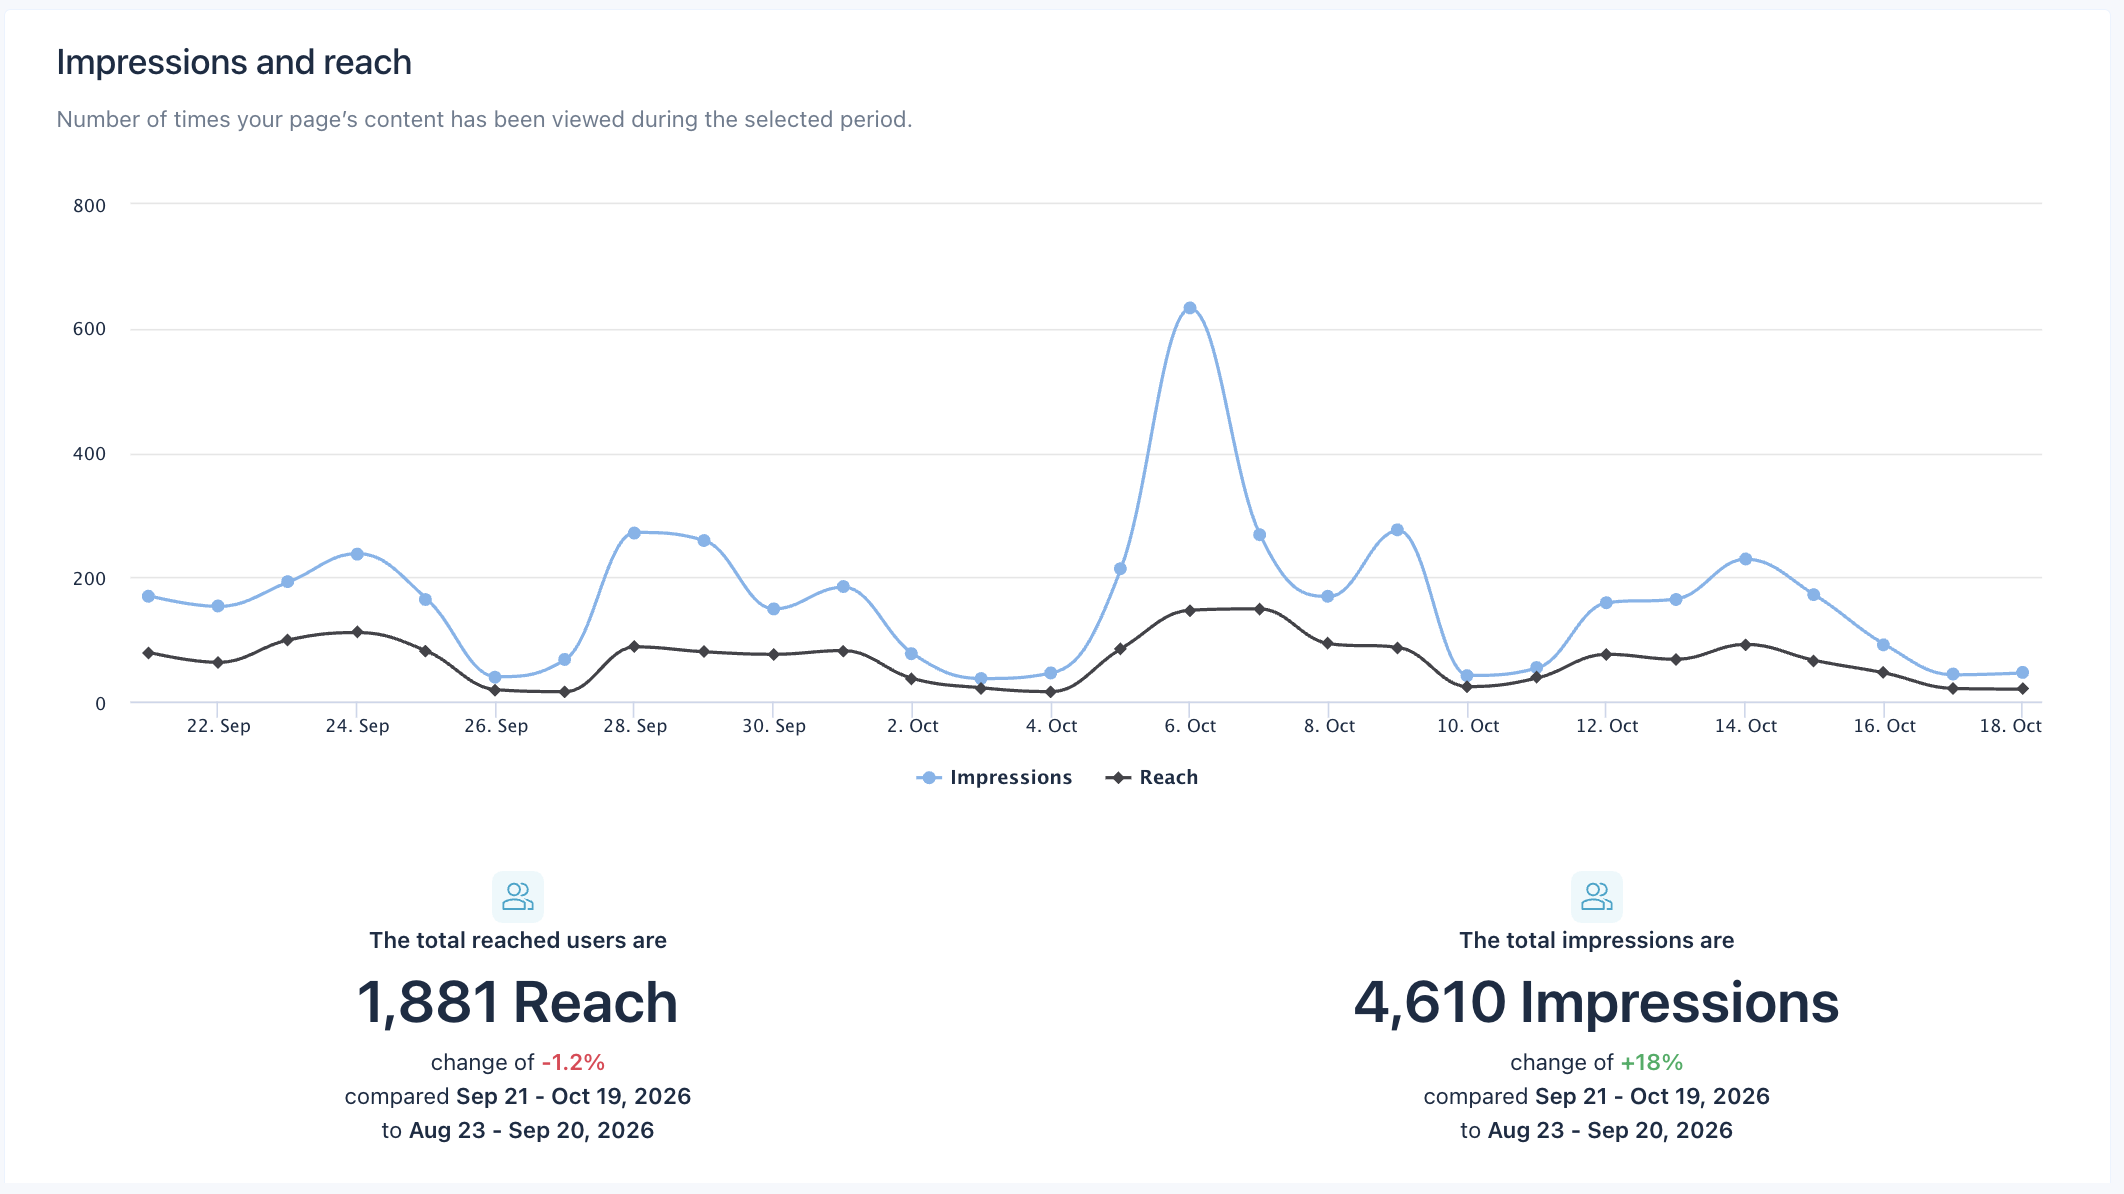
Impressions and reach
The number of times your page’s content was viewed (impressions) and the number of unique users who saw it (reach) each day during the selected period, with totals and the change compared to the previous period.
Hashtags & interactions
Shows the number of interactions generated by hashtags used in your posts.
Followers by demographics
Breaks down your followers by company size, seniority, job function, industry, and country. LinkedIn only reports a breakdown when it can identify enough of the underlying data, so these numbers can add up to less than your total follower count.
Post Performance Report
A breakdown of how your published posts performed during the selected period, including averages per post, impressions, engagement, and your top performing posts.
Engagement quality
The share of impressions that led to an interaction (like, comment, share, or click) versus those that didn’t. Next to the chart, you’ll find your current engagement rate, total engagement interactions, and total impressions.
Posts and engagement by tag
How your published posts and your total engagement are split across tags during the selected period. Use the two charts to compare which tags you post most with which ones drive the most engagement.
Top performing posts published during the selected period
Included metrics:
- Impressions (total)
- Likes
- Comments
- Shares
- Engagement
Need further help?
If you have any questions or need additional help, feel free to contact our awesome support team. We are here to assist you! 💙
Related Reading:
Build a custom report template
Sign up now and try Vista Social for 14 days, free!