
| Plan | ✓ Professional ✓ Advanced ✓ Scale ✓ Enterprise |
Profile Performance Report
Cross channel report summary
This section shows the total number of followers, posts, engagement, awareness, and impressions based on the selected time period.
Social Profile Performance
This section shows the comparison of key statistics across selected profiles.
 Audience Growth
Shows the number of followers gained during the selected period.
Engagement
Shows the daily engagement broken down by network. Engagement includes likes, comments, shares, and reactions.
Total fans and total engagement
Shows in a pie graph, the total fans and total engagement across the selected networks.
Posts
Shows the published posts broken down by network during the selected period.
Brand Awareness
Shows brand awareness which includes any mentions, shares, and messages for the selected period.
Post impressions
The number of times your posts were displayed each day during the selected period, stacked by network, with the total for each network and the change compared to the previous period.
Video plays
Shows how many times your videos were played during the selected period, with one bar per network and an Overall video plays total. Each network counts a play its own way (Facebook, for example, counts plays of 3 seconds or more, including autoplay), so this isn't a total view count. Hover the info icon next to the section subtitle to see how each network counts a play. Only networks with video plays show in the chart.
Hashtags & Interactions
Shows the number of interactions generated by hashtags used in your posts.
Post Performance Report
Per post averages
What an average post achieved during the selected period. The table shows total posts, engagement, average engagement, engagement rate, impressions, and average impressions, with the change compared to the previous period.
Posting timeline
The number of posts you published each day during the selected period, stacked by network.
Posts, impressions, and engagement by network
How your total posts, impressions, and engagement are split across your connected networks. Use the three charts to compare where you publish most with where you get the most reach and engagement.
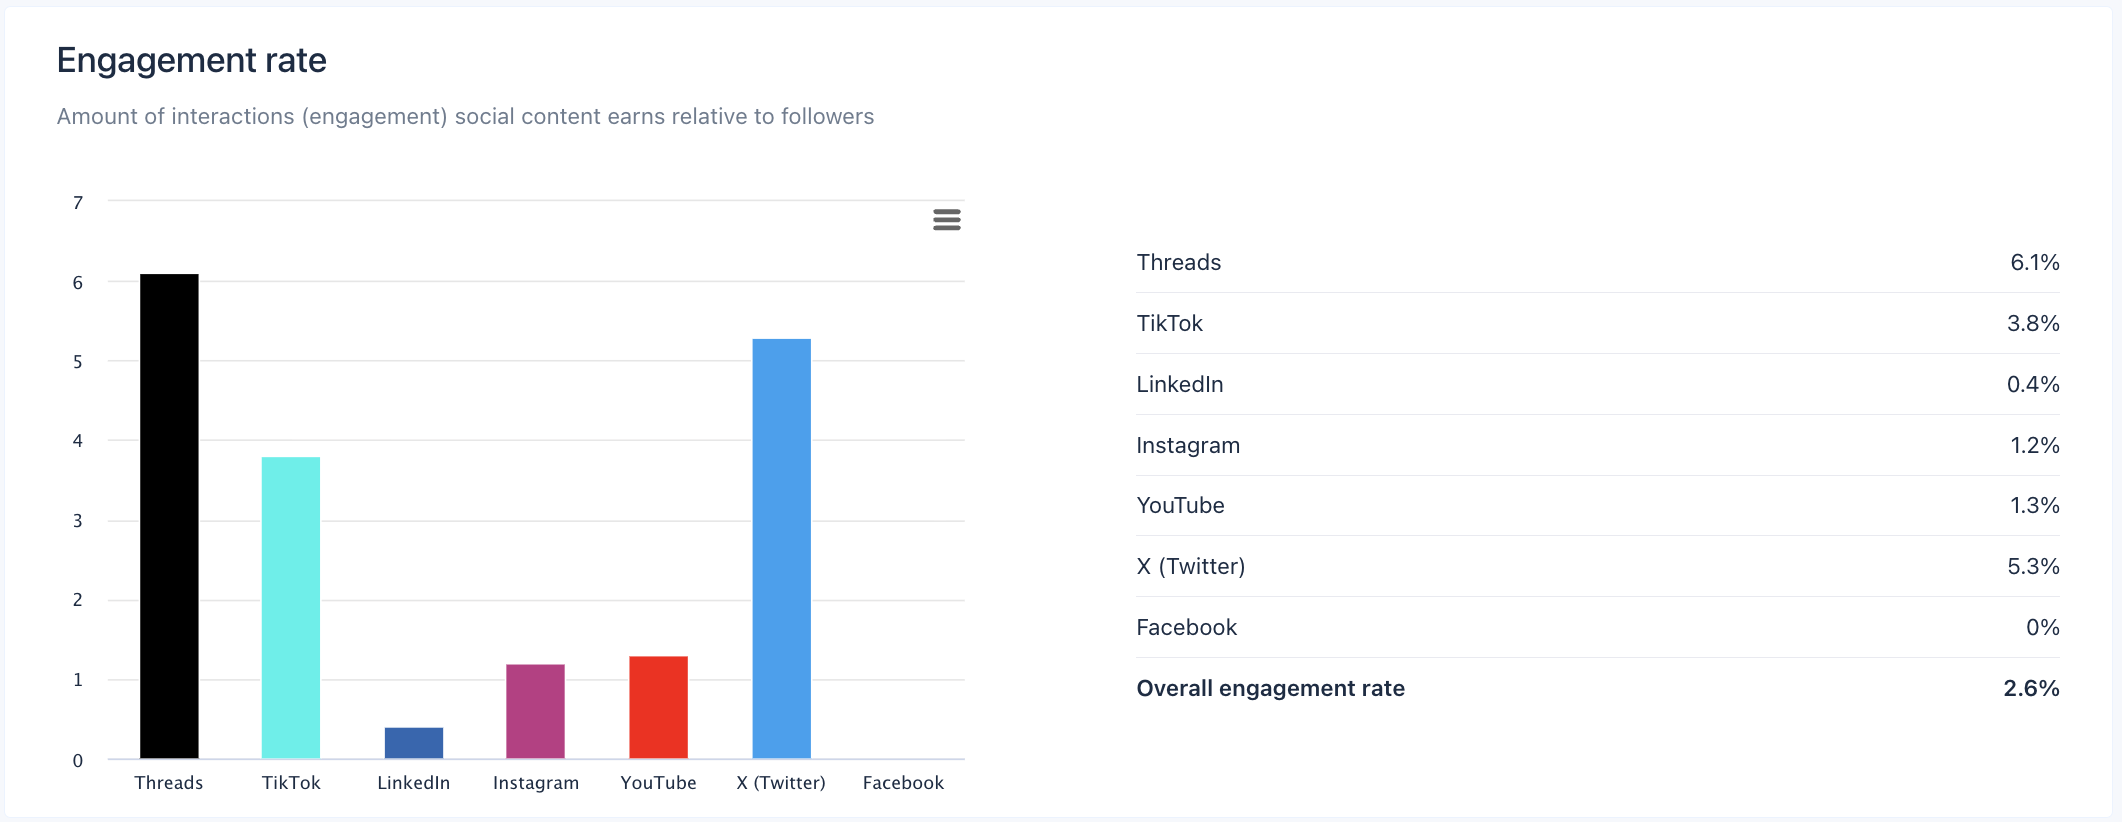
Engagement rate
Engagement divided by impressions: how many of the people who saw your posts interacted with them, shown by network with an overall engagement rate.
Posts and engagement by tag
How your published posts and your total engagement are split across tags during the selected period. Use the two charts to compare which tags you post most with which ones drive the most engagement.
Post performance section
Shows a breakdown of the top performing posts published along with the following metrics: impressions, likes, comments, shares, and total engagement within the selected time period.
Frequently Asked Questions
Q: Why is Overall video plays so much lower than Impressions?
A: They measure different things. Impressions count every time your content was shown and can include paid impressions. Video plays only count plays of your videos, using each network's own rules for what counts as a play, so the two aren't comparable.
Need further help?
If you have any questions or need additional help, feel free to contact our awesome support team. We are here to assist you! 💙
Related Reading:
Social Media Performance Report
Build a custom report template
Sign up now and try Vista Social for 14 days, free!