
| Plan | ✓ Professional ✓ Advanced ✓ Scale ✓ Enterprise |
The Work performance report helps you understand how your team is creating, completing, and managing tasks across your VistaWork projects.
Use this report to monitor workload, identify work that is taking longer to complete, track completion trends, and understand where your team's work is coming from.
How to run the report
1. Go to Reports → More reports → Work performance.
2. Filter by project or priority, choose a report template, and set your date range and comparison period.
3. Click Run report.
|
Note The filters you select determine which work is included in the report, so make sure your project, priority, and date range match the period you want to analyze. |
Understanding the report
The Work performance report is divided into several sections, each providing a different view of your team's workload and productivity.
Top-line metrics

The top of the report provides a quick overview of your team's performance during the selected period.
- Work completed: The number of tasks completed during the selected period.
- Work created: The number of tasks created during the selected period.
- Median cycle time: The median amount of time it took for tasks to go from creation to completion.
- On-time completion: The percentage of tasks that were completed by their due date.
- Median time to first action: The median amount of time before a task received its first update.
These metrics give you a quick way to understand how much work your team is handling and how efficiently that work is moving toward completion.
Performance insight
The Performance insight section provides an automatically generated summary of activity during the selected period.
For example, the summary may highlight periods when little or no work was created or completed.
If available, click View recommendations to see suggested next steps based on the report summary.
Aging work in progress
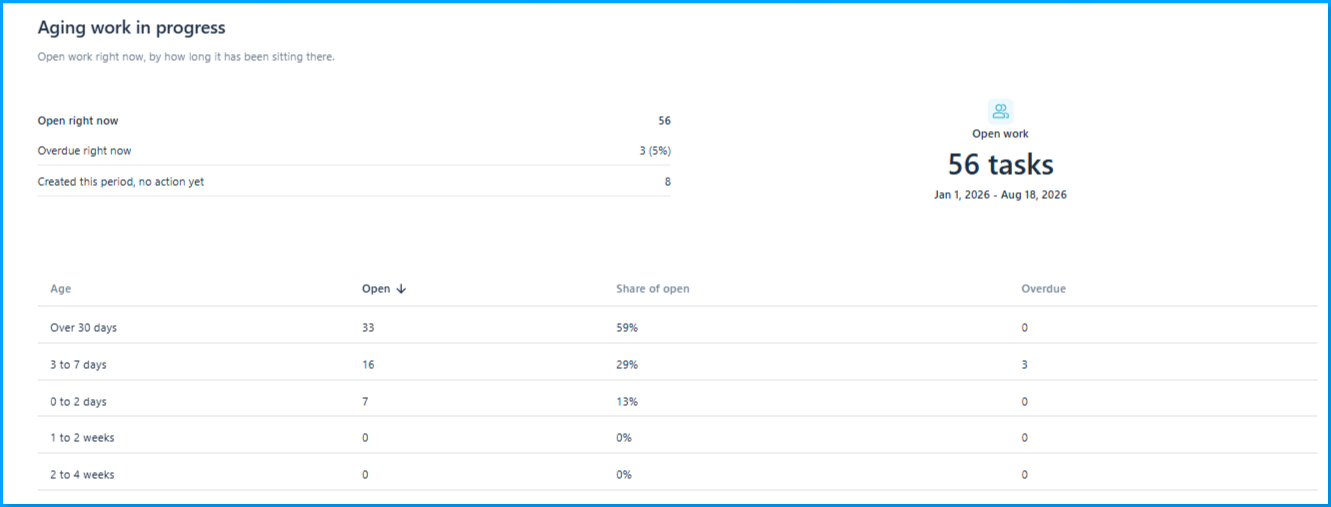
The Aging work in progress section helps you understand how long your currently open work has been sitting and identify work that may require attention.
It includes:
- Open right now: The number of currently open tasks.
- Overdue right now: The number of currently open tasks that are overdue.
- Created this period, no action yet: Tasks created during the selected period that have not received an action yet.
The report also groups open work into age ranges, from 0–2 days through over 30 days.
For each age range, you can see:
- The number of open tasks
- Their percentage of the total open work
- How many of those tasks are overdue
|
Note A task being open for a long time does not necessarily mean that it is overdue. The aging and overdue indicators measure different aspects of your open work. |
Created and completed
The Created and completed section shows how many tasks were created and completed on each day during the selected period.
The section also provides totals for:
- Created
- Completed
- Net change
- Open at the end of the period
Use these numbers to understand whether your workload is increasing or decreasing.
For example:
- If more tasks were created than completed, your open workload increased.
- If more tasks were completed than created, your open workload decreased.
- If the numbers are similar, your workload remained relatively stable.
Performance by team member
The Performance by team member section shows how work is distributed across individual assignees. Use it to understand how many tasks each person has completed, how quickly they are being handled, and how much work is currently assigned to them.
The table includes:
- User: The team member assigned to the task. An Unassigned row is shown for tasks that do not have an assignee.
- Completed: The number of tasks completed by the team member during the selected period.
- Cycle time: The time it typically took to complete the tasks included in the report.
- On time: The percentage of completed tasks that were completed by their due date.
- First action: The time before the assigned work received its first action.
- Reopened: The number of tasks that were reopened during the selected period.
- Open now: The number of currently open tasks assigned to the team member.
- Overdue now: The number of currently open tasks assigned to the team member that are overdue.
|
Note Tasks assigned to more than one person are counted for each assigned team member. As a result, the totals in this table may add up to more than the overall totals shown elsewhere in the report. |
Use this section alongside the other report metrics to identify workload distribution, open or overdue work, and differences in task completion and response times across team members.
Work breakdown
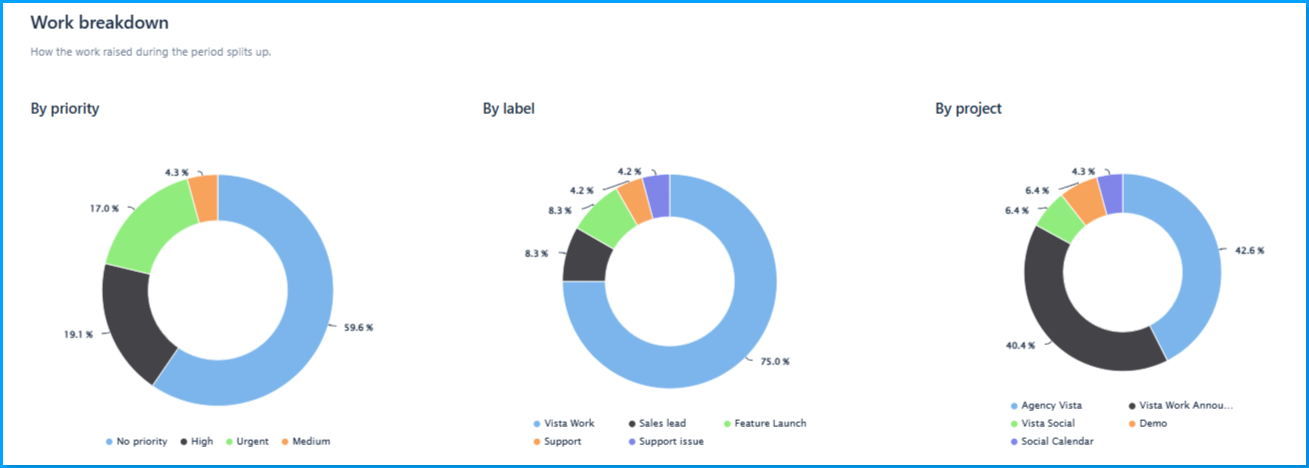
The Work breakdown section shows where your team's work is coming from.
You can view the work created during the selected period by:
Priority
See how work is distributed across different priority levels. This can help you understand how much of your team's workload is high-priority versus lower-priority work.
Tag
See how work is distributed across tags. This can help identify the types or categories of work your team is handling most frequently.
Project
See how work is distributed across projects. This can help you identify which projects are generating the most work.
How to use the report
The Work performance report can help you identify trends and areas that may need attention.
Consider reviewing:
- Aging work to identify tasks that have remained open for an extended period.
- Overdue work to identify tasks that have passed their due dates.
- Created vs. completed work to understand whether your workload is growing or shrinking.
- Projects with high volumes of work to understand where your team's capacity is being used.
- Work with no action yet to identify newly created tasks that may not have been picked up.
For a more complete picture, compare different periods instead of looking at a single reporting period in isolation.
Frequently Asked Questions
Q: Where do I find the work performance report?
A: Go to Reports → More reports → Work performance.
Q: Can I filter the report by project or priority?
A: Yes. Use the Project and Priority filters at the top of the report.
Q: What does Median cycle time mean?
A: It shows the median amount of time it took for tasks to move from creation to completion during the selected period.
Q: What does Median time to first action mean?
A: It shows the median amount of time before tasks received their first update.
Q: What does Aging work in progress show?
A: It groups currently open tasks by how long they have been open, from 0–2 days through over 30 days. It also shows how many tasks in each age range are overdue.
Need help?
Reach out to our support team, and we are happy to help.
Related Reading:
Getting started with VistaWork
Creating and managing tasks in VistaWork
Creating and managing projects and statuses in VistaWork
Sign up now and try Vista Social for 14 days, free!